At a glance
Cushman & Wakefield’s 2026 Global Data Center Market Comparison, its seventh edition, ranks 107 markets across 24 variables and reframes its headline thesis from 2025’s “accelerated growth” to “managed growth amid opposition”.
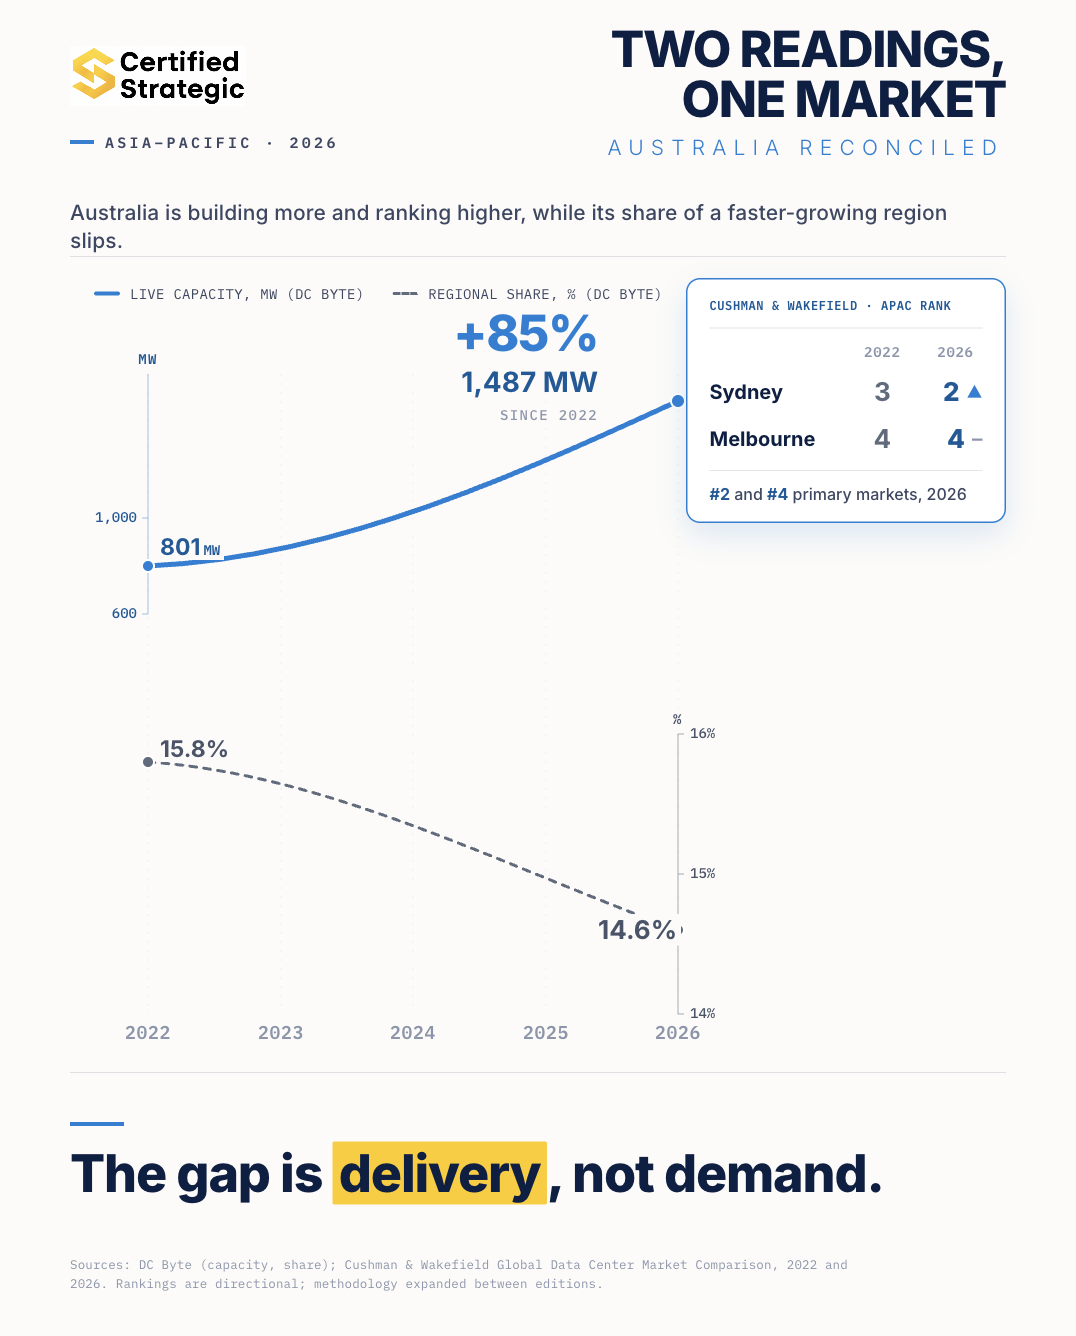
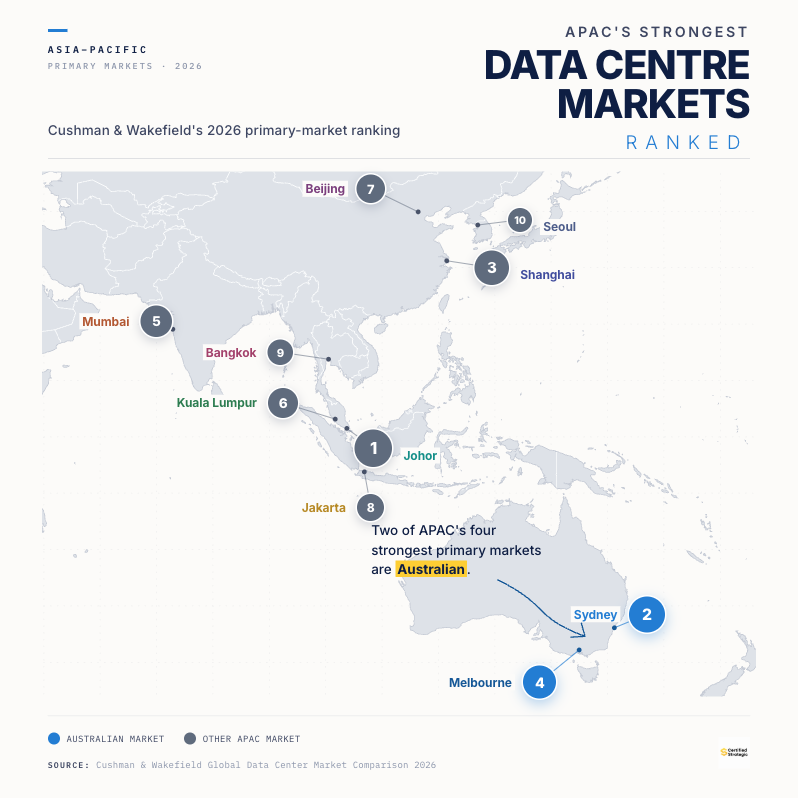
In Cushman’s APAC ranking, Sydney places second and Melbourne fourth among primary markets, Canberra first and Brisbane fourth among tertiary markets, and Perth sixth. Two of the four highest-ranked APAC primary markets are Australian.
APAC operational capacity reached 13.8GW in 2025, up more than 1.5GW or 13% year on year, with colocation vacancy falling to 10.9%. The region carries 3.7GW under construction and roughly 15.7GW planned, plus more than 52GW of secured land banks.
Cushman names Sydney, alongside Mumbai and Johor, among the markets set to cross 1GW of operational capacity by the end of 2026. Sydney already sits inside the seven markets that hold about 60% of APAC’s live capacity.
The ranking sits beside DC Byte data showing Australia’s share of APAC-excluding-China capacity easing from 15.8% to 14.6% since 2022. Market quality and raw capacity share are measuring different things.
Regional constraint is infrastructure, namely power, water and talent, rather than demand. That echoes CBRE’s projected 1.5GW Sydney and Melbourne shortfall by 2028.
Two datasets
Read one way, Australia is a top-tier regional market. Cushman & Wakefield’s 2026 Global Data Center Market Comparison, published in late May, ranks Sydney as the second-strongest primary market in Asia Pacific and Melbourne as the fourth. Canberra leads the region’s tertiary markets outright.
Read another way, the Australian story this quarter is a share decline. Capacity data from DC Byte, a data centre market-intelligence firm, circulated at the Sydney Data Centre Exchange in late May, put Australia's slice of APAC-excluding-China live capacity at 14.6%, down from 15.8% in 2022, even as Australian capacity grew 85% over the four years. We set that out in full in our analysis of Australia’s APAC capacity share.
The share number tracks megawatts against a regional denominator that includes China and the fast-scaling South and Southeast Asian markets. Cushman’s ranking scores 24 variables spanning market fundamentals, power, terrestrial factors such as land and fibre, and the political and regulatory environment. A market can lose ground on raw capacity share while ranking near the top on the attributes that determine where capital chooses to deploy. Australia is doing both at once.
What the 2026 report measures
The Global Data Center Market Comparison is now in its seventh edition and covers 107 markets across 24 ranked variables. This year’s defining change is editorial. The 2025 report summarised the global market in two words, “accelerated growth”. The 2026 report retires that framing for a more guarded one: managed growth amid opposition.
The shift reflects a market where power availability is no longer the only gating item. Community sentiment, moratoria and prescriptive approval criteria now reshape where, when and how facilities get built, with project denials and cancellations recorded across several regions in the past 12 months. The report also notes a degree of financial self-regulation, as investors press operators to show how capital intensity converts into profit rather than treating scale as inevitable.
Region | Operational | Under construction | Planned | Colo vacancy | Projected total-capacity multiple |
Americas | 43.4GW | 25.3GW | 191.3GW | 4.2% | 6.0x |
APAC | 13.8GW | 3.7GW | 15.7GW | 10.9% | 2.4x |
EMEA | 11.4GW | 2.7GW | 12.1GW | 7.8% | 2.3x |
Source: Certified Strategic Editorial, Cushman & Wakefield 2026 Global Data Center Market Comparison.
APAC operational stock grew by more than 1.5GW during the year, a 13% increase, while vacancy fell from 12.4% in late 2024 to 10.9% in late 2025. Beijing remains the only market above 2GW. Roughly 60% of APAC’s live capacity concentrates in seven markets: Beijing, Johor, Mumbai, Shanghai, Singapore, Sydney and Tokyo. Johor recorded the region’s fastest growth, expanding 124% from about 400MW to 897MW.
Where Australia lands in the APAC ranking
Cushman’s overall ranking groups markets into primary, secondary and tertiary tiers by size, then ranks each market within its tier. Australia appears at the top of two of the three tiers.
APAC rank | Market | Country |
1 | Johor | Malaysia |
2 | Sydney | Australia |
3 | Shanghai | China |
4 | Melbourne | Australia |
5 | Mumbai | India |
6 | Kuala Lumpur | Malaysia |
7 | Beijing | China |
8 | Jakarta | Indonesia |
9 | Bangkok | Thailand |
10 | Seoul | South Korea |
Source: Certified Strategic Editorial, Cushman & Wakefield 2026 Global Data Center Market Comparison (APAC primary-market ranking).
Sydney and Melbourne occupy two of the top four positions, ahead of Beijing, Jakarta and Seoul. In the tertiary tier, Canberra ranks first in APAC, Brisbane fourth and Perth sixth. The spread matters because it captures markets beyond the Sydney and Melbourne axis that carries most of the national pipeline, a concentration we examined in our read on Australia’s top 10 APAC data centres. Canberra’s placement reflects sovereign and government-adjacent demand, the market anchored by CDC Data Centres, whose Canberra government campuses are certified at the federal Hosting Certification Framework’s highest tier, Certified Strategic. Perth and Brisbane reflect grid headroom and emerging hyperscale interest.
Cushman also lists Sydney among the markets set to cross 1GW of operational capacity by the end of 2026, alongside Mumbai and Johor. That places Sydney’s near-term trajectory in the same sentence as the two fastest-scaling markets in the region.
Why share slips while the ranking holds
Cushman's ranking and the capacity-share figures point in different directions because they measure different things, and both are accurate. Cushman scores market quality: connectivity, grid maturity relative to peers, regulatory predictability and a deep customer base, on all of which Australia rates highly. Capacity share measures something narrower, raw megawatts against a faster-growing regional total, and on that basis Australia is adding capacity more slowly than its regional peers.
The variable that explains the gap is delivery, not desirability. DC Byte’s national forecast tracks Australian operational capacity rising from 1.4GW in 2025 to 3.2GW by 2030, with 16.8GW of the 21.6GW headline pipeline sitting in an early-stage phase that has not secured all of land, power and permits. CBRE’s 2026 outlook reaches the same conclusion from a different direction, projecting a combined 1.5GW supply shortfall across Sydney and Melbourne by 2028 even after a wave of pre-leased construction. We covered that finding in our analysis of CBRE’s APAC outlook, which placed Australia in CBRE’s five-market Leading tier.
Three reputable datasets now describe the same market from three angles. Cushman ranks it near the top of the region on quality. DC Byte shows its capacity share easing under a faster-growing regional denominator. CBRE quantifies the supply gap that the demand is running into. The unifying read is a market wanted by capital and constrained by buildout speed.
Infrastructure, not demand, is the binding constraint
Infrastructure challenges are the constraint, not demand. Power grids, water supply and talent pools need to evolve as fast as demand is accelerating, and in the markets where infrastructure keeps pace, operators are now securing pre-commitments at the land stage, something that was not happening 12 months ago.
That diagnosis maps directly onto Australia’s settings. The binding item is grid connection, which we tracked in our coverage of AEMO’s data centre transmission pipeline, and the planning and approval environment now shaped by the NSW reforms set out in our read of the NSW data centre consultation paper. In Australia the demand is proven; the rate of delivery is set by power, water, land and approvals.
This is the same window we have argued runs through the next 12 to 18 months. Markets that energise large loads on a two-to-three-year timeline hold their ranking and convert pipeline. Markets that cannot watch capacity migrate to peers with shorter power-delivery queues.
Powered land and preleasing reset the development model
Two structural shifts in the report carry directly into Australian deal economics. The first is powered land. Across APAC, sites with secured power approvals now command a clear premium over unpowered parcels, prompting landowners to pursue early grid connectivity to lift asset values. Cushman frames this as power-led site selection, where land is valued for its ability to unlock capacity rather than its real estate fundamentals alone. Firmus illustrates the same logic in Australia: it sited Project Southgate in Tasmania for renewable power and is scaling the AI factory model across Melbourne, Sydney, Canberra and Perth toward 1.6GW by 2028, a build we tracked in our Project Southgate coverage.
The second is preleasing depth. Nearly all APAC capacity under construction is already preleased, with most operators breaking ground only after securing firm customer commitments, and more than 30% of planned capacity is preleased as well. That demand is increasingly led by AI workloads and by the neocloud operators we profiled in our neocloud market report. Two Australian markets rank among the report’s global leaders on this measure. Canberra sits inside the tied-highest group of markets worldwide for preleasing of under-construction capacity, and Melbourne makes the global top 10. Australian capacity is being committed well ahead of delivery.
Together these dynamics raise the strategic value of any Australian site that pairs land with firm, near-term power, and they reward operators who secure offtake before turning earth. They also reinforce the investment thesis tracked in our Australian AI infrastructure wealth analysis, where capital is moving toward contracted, power-anchored assets.
What to watch
The near-term test is whether Sydney crosses 1GW of operational capacity by the end of 2026 on Cushman’s timeline, and whether Australia holds its primary-tier ranking into the 2027 edition. The leading indicator is power. Markets that shorten energisation queues and convert early-stage pipeline into committed capacity will defend their position; those that do not will cede share to Johor, Mumbai and the Southeast Asian markets scaling fastest. Watch AEMO connection approvals, NSW and Victorian planning outcomes, and the rate at which the 16.8GW national early-stage pipeline migrates into the committed phase.